On-demand Xdebug with PHPUnit and Laravel in PhpStorm

Lead developer at 3rdRisk.com. Proud father of two kids. Tech optimist. Apple and Laravel enthusiast.
On-demand Xdebug with PHPUnit and Laravel in PhpStorm
TLDR;
This guide will make you install Xdebug on your Mac without the performance downsides, but still being able to use all the Xdebug goodnesses. Most Xdebug setups only allow you to use it through a web browser plugin. This is not helpful when you’re following a TDD approach. So we’ll get it to work right from your tests in PhpStorm, no browser needed!
Having tests is awesome!
I’m a huge fan of tests in Laravel and try to develop as much as possible using the TDD approach. When a project grows over the years, your tests are becoming like a guard that will tell when you messed up functionality by adding or changing some code later on. This gives a peace of mind and has saved my bacon many times already.
PhpStorm has a great GUI for running PHPUnit tests where you’re able to click directly on the links to the scripts where a test fails. I love this workflow and I’ve never used phpunit on the command line since. However, when your tests fail, it can become somewhat cumbersome to figure out what is going on. The first thing I always do is add ->dump() to the request, that will point me in the right direction most of the time. But there are cases where you really need to dig into the code. This is where I previously placed some dd() in the code and then tried to follow the steps. Raise your hand if you’ve been there 🤚!
Xdebug is a wonderful tool that can help you with that, but I previously used it a long time ago with a browser plugin. Since PHPUnit gets really slow when Xdebug is installed and it also impacts the composer performance, I removed it from my system and never used it since. Until I recently discovered “on-demand Xdebug” in PhpStorm! This will not enable Xdebug by default, and will only use it when you need to. It’s really simple to set up and I love using it! You can also use it directly in your tests, so you don’t have to recreate the situation in your browser. I’ll show you how to install and use it in this article.
Install
In our company we only use Mac’s, I have no idea how to set this up on Windows, so you’ll have to google around if that’s your case. For Linux, it will more or less be the same (except for PHP installation) I think.
I’m assuming you’ve been using Homebrew to install the latest version of PHP. It’s as simple as brew install php.
Extensions as Xdebug have recently been removed from Homebrew and need to be installed using PECL. Luckily that is also really easy!
pecl install xdebug
The install will add a reference to Xdebug in your php.ini file so it will be loaded by default. We don’t want that! So we’ll remove this reference. Here’s how to do it:
On your command line enter: php --ini this will give you the path of the php.ini file that is used on your system.

Open the file in an editor of your choice, or use the default editor for this filetype. In the case of our example, we can do this with the command
open /usr/local/etc/php/7.2/php.ini. This will open the php.ini file.
We can see the reference added by the Xdebug installer on line 1: zend_extension=”xdebug.so”. We need to remove this line so Xdebug is not loaded by default anymore. There, all done 🥳!
PhpStorm setup
I’ll assume you have a setup for your TDD workflow in PhpStorm. The purpose of this guide is only to extend it with Xdebug. If you don’t have it, here is an old but still relevant video from Laracasts.com: Be Awesome in PHPStorm: Testing in PHPStorm.
We will need to tell PhpStorm where Xdebug is located for using it on demand. In the settings navigate to Languages and Frameworks and then PHP. On the CLI Interpreter click on the … button like in the screenshot.

Now we can specify where Xdebug is located on your system. In our example this is in /usr/local/lib/php/pecl/20170718/xdebug.so, but this path depends on the version and can be different on your system. So be sure to click on the folder icon to navigate through your system and find it.
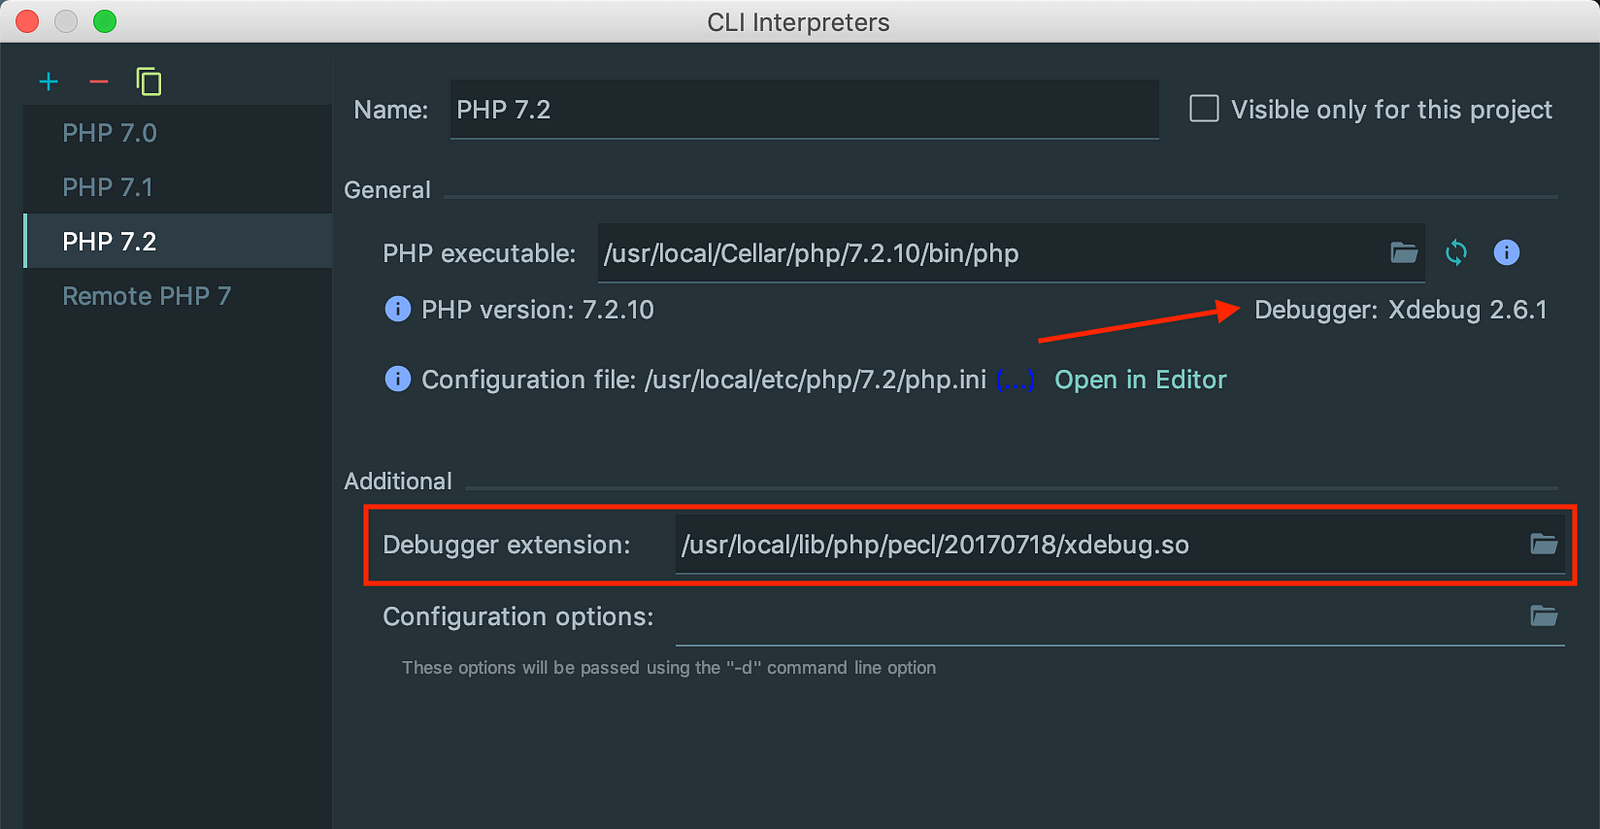
When the path is correct and you hit the refresh button, you will see the Xdebug version that was found by PhpStorm.
Using it
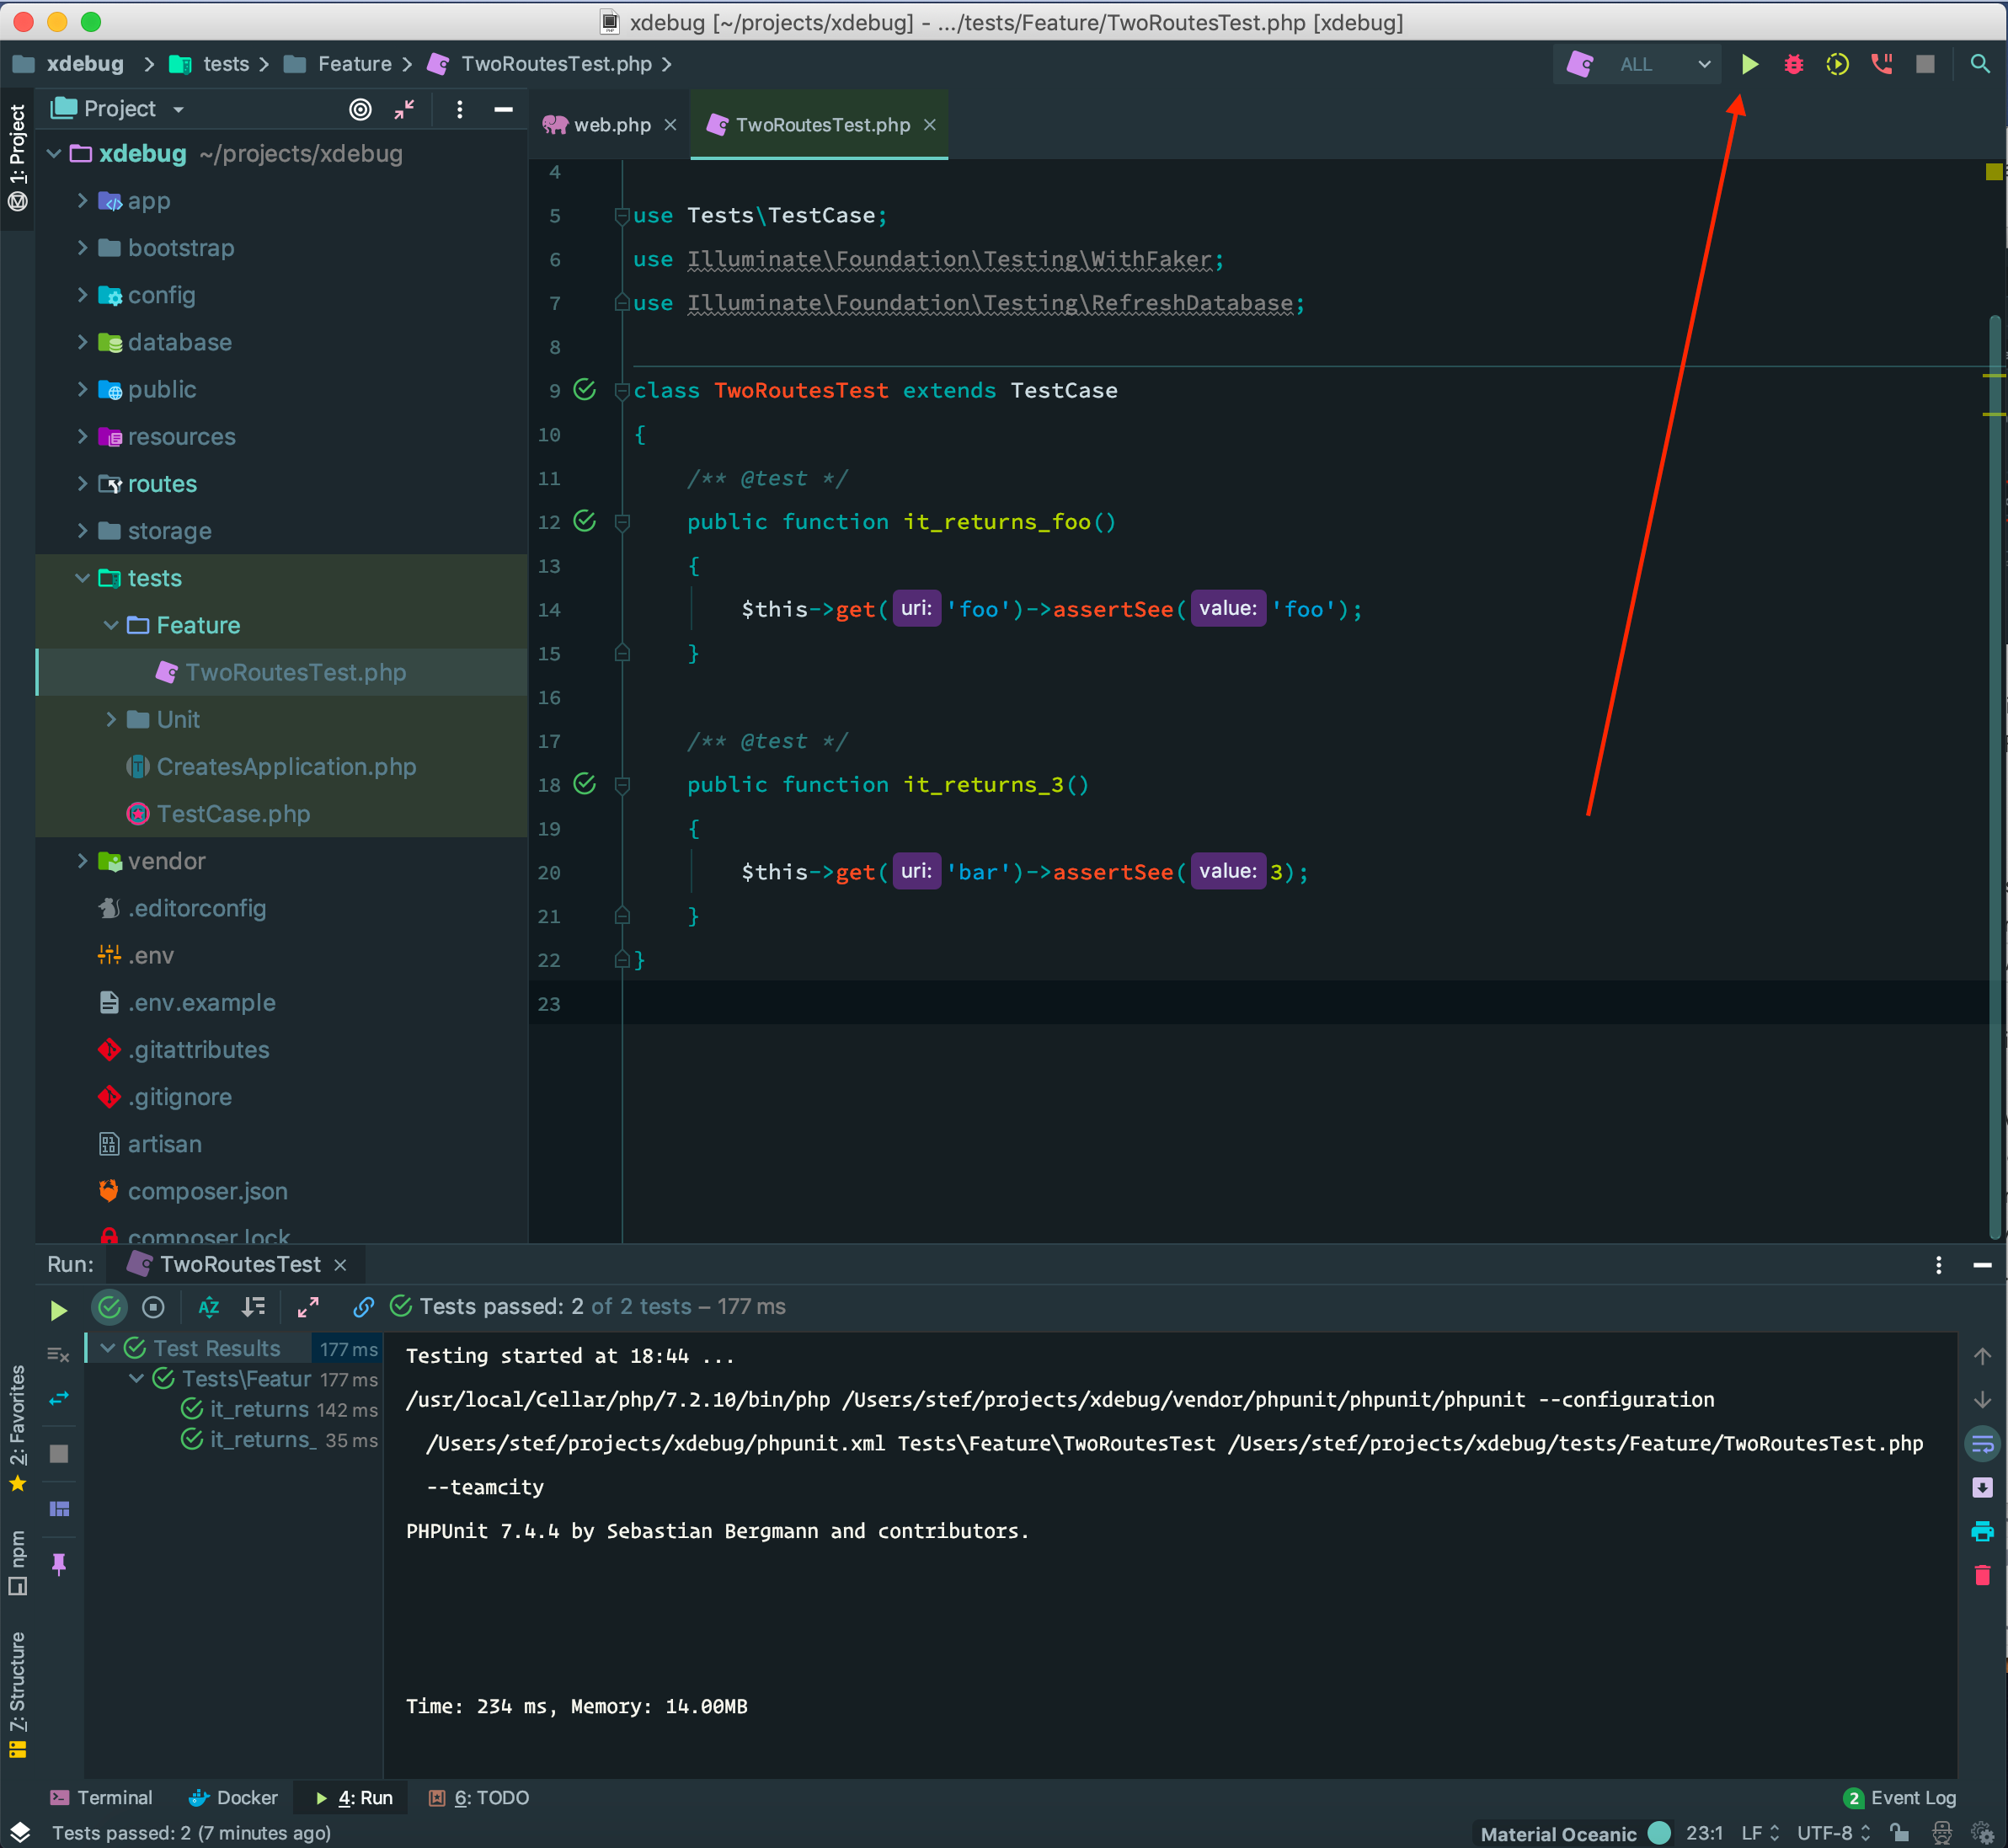
For sake of simplicity, we’ll create a simple test where we assert the content of two routes. The routes we’re about to test will just return some variables, nothing fancy going on here, you’ll get the idea. Laravel makes creating tests really easy with the artisan helper php artisan make:test TwoRoutesTest.
In the image below you can see how the tests are run when you’ll hit the green “play” button, nothing new here. Did you also know about the SHIFT + CTRL + R shortcut? Place your cursor in a test and hit the shortcut and only this single test will run. When you place the cursor outside of a test, all the tests of this test-file will run. I really love this shortcut 😍!
Now, let's use Xdebug!
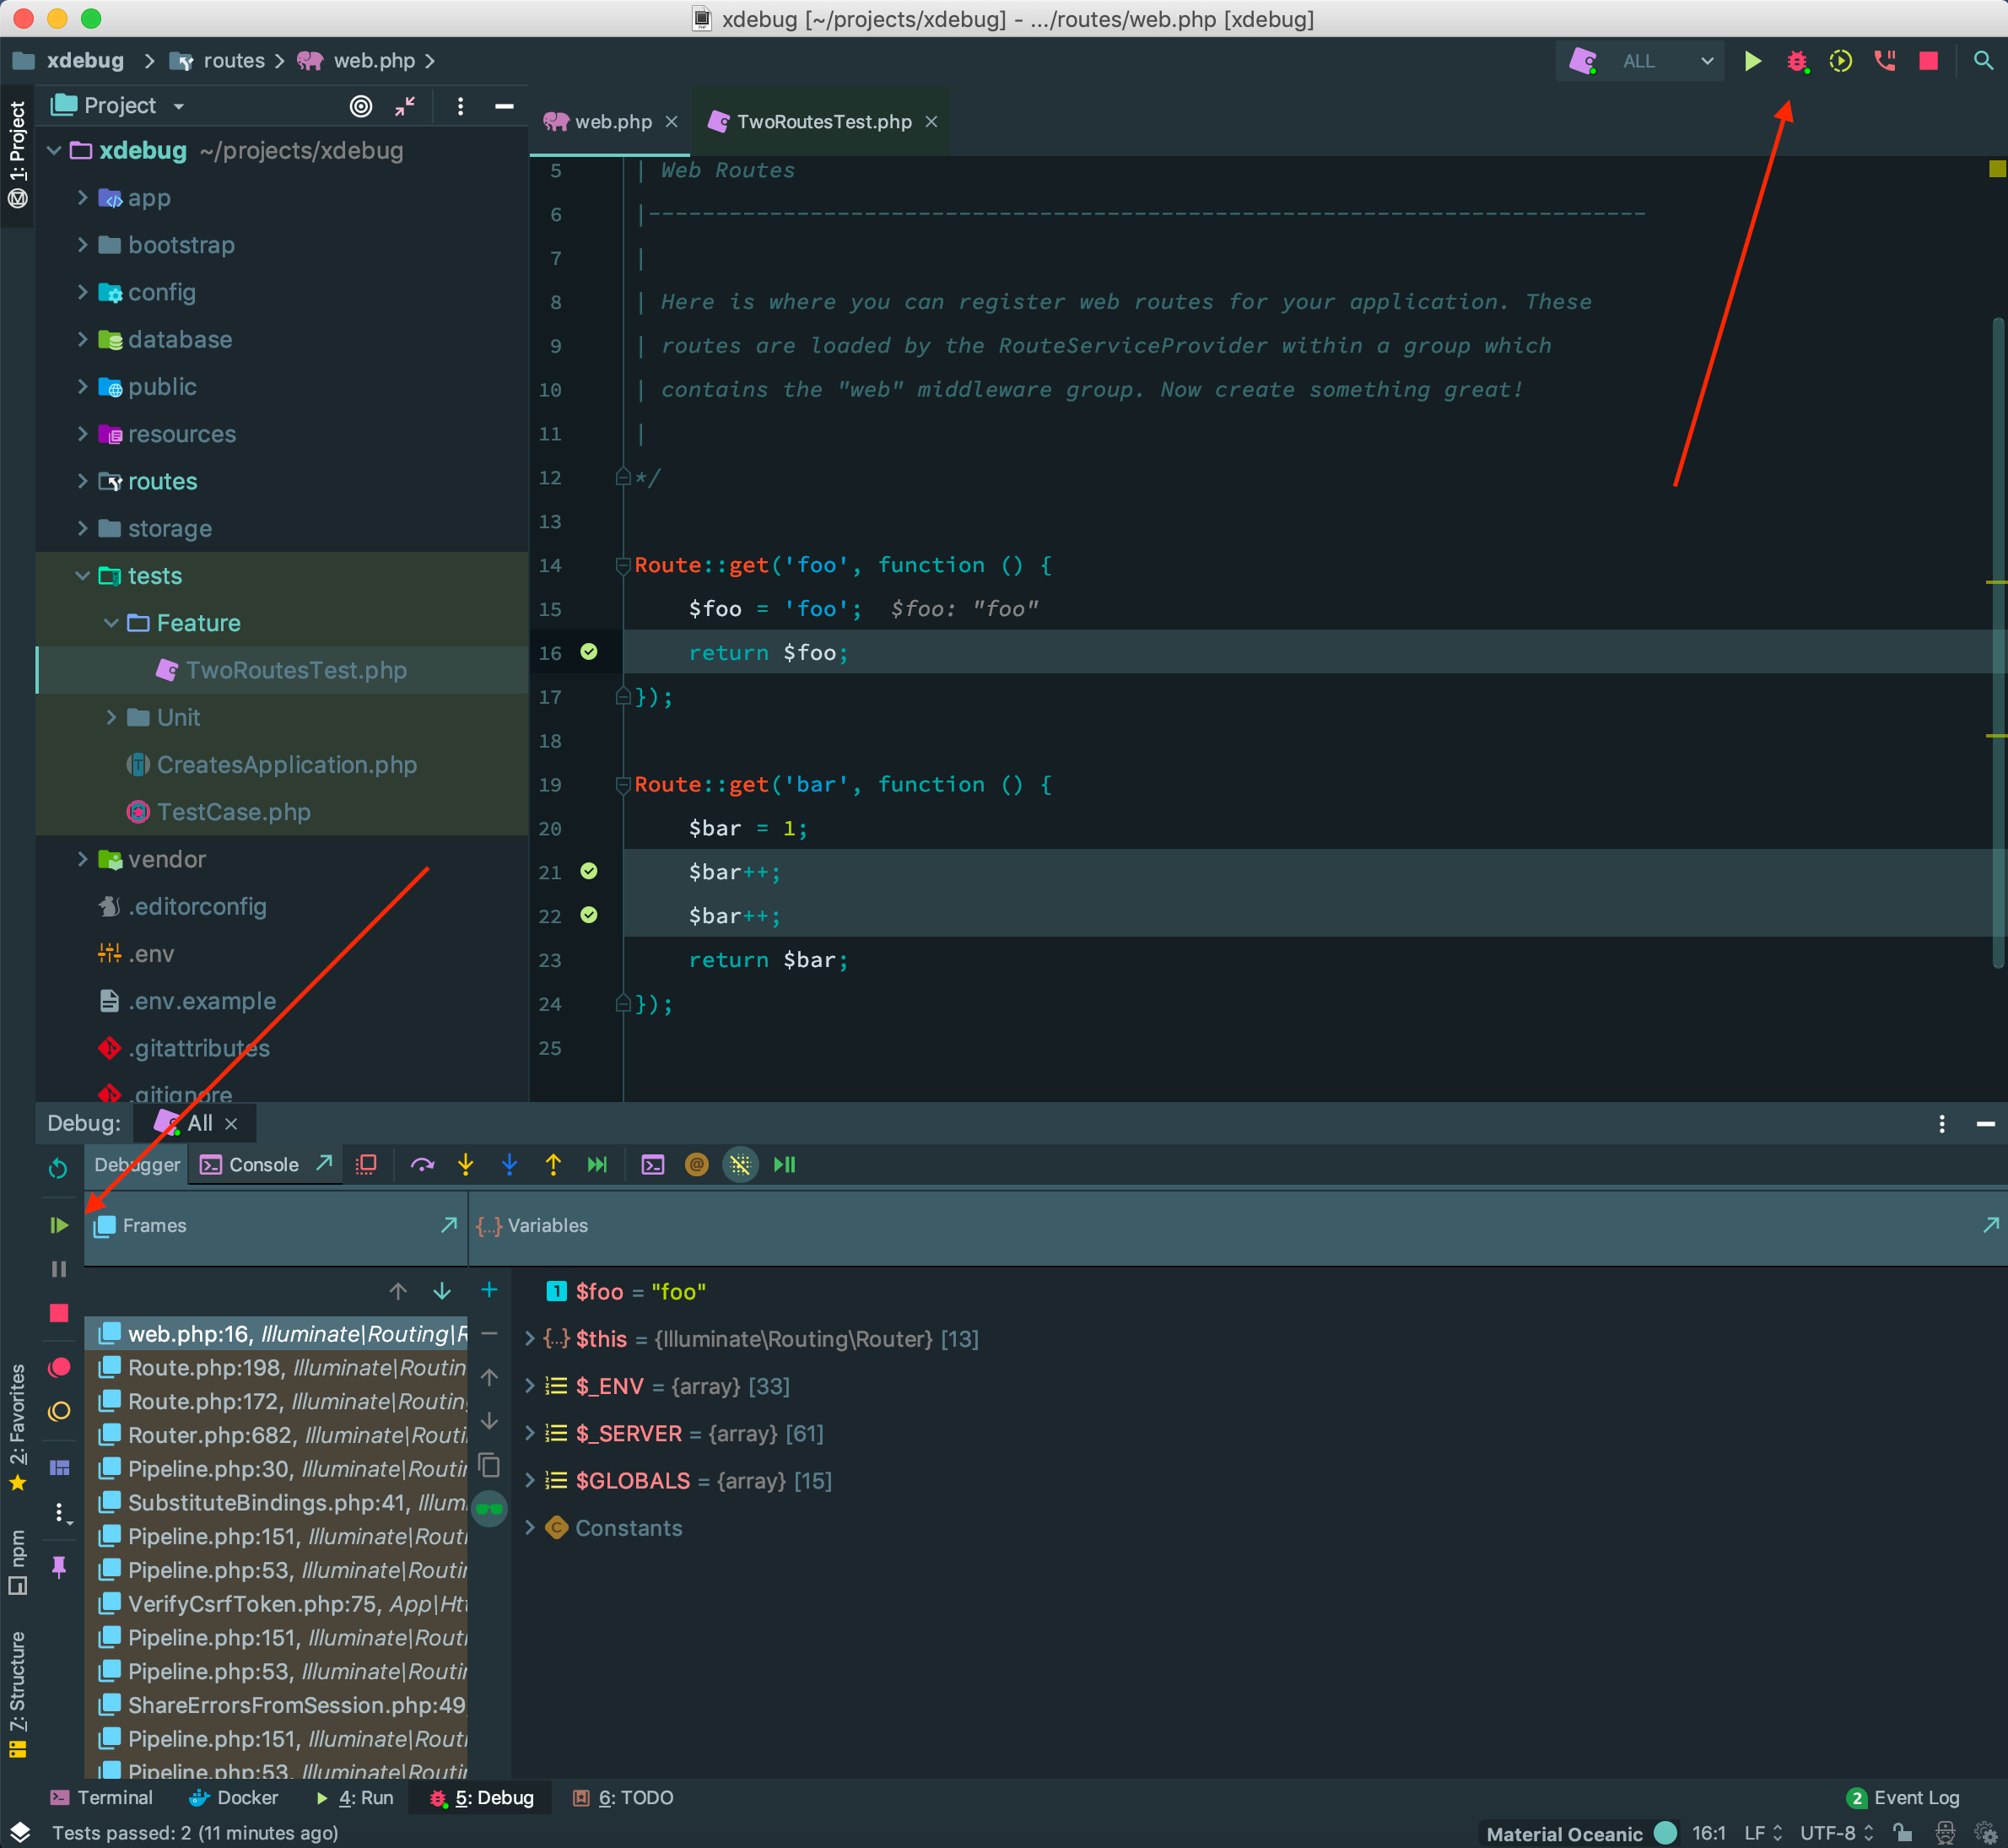
Go to your code and place some breakpoints on the left side of the lines. They will be marked with red circles when you click them. This time, don’t click the green “play” button, but the red bug on the right side of it.
The test will stop on the first breakpoint. You’ll get a nice overview of all (global) variables in the debug screen. When you press the green “play / pause” button on the left side of the screen you’ll go to the next breakpoint. You can really dig in the code now to figure out where your bugs happen. I won’t go into detail about all the PhpStorm/Xdebug functionality. That might be a completely different blog post.
Happy debugging
I hope this will enhance your debugging workflow as much as it did for me!
